
Summary and Statistics
The main purpose of collecting log records of your activities is getting summaries and statistics of those grouped by activity.
Summary

On the top row you select the period and if they are presented in ascending or descending order. The periods you can select range from Daily (D), Weekly (W), Monthly (M), Quarterly (Q), Yearly (Y) to Total (T).
For each period and activity the count of logs and the sum of durations during that period are shown.
The logs being taken into account may be limited by a filter.
Statistics
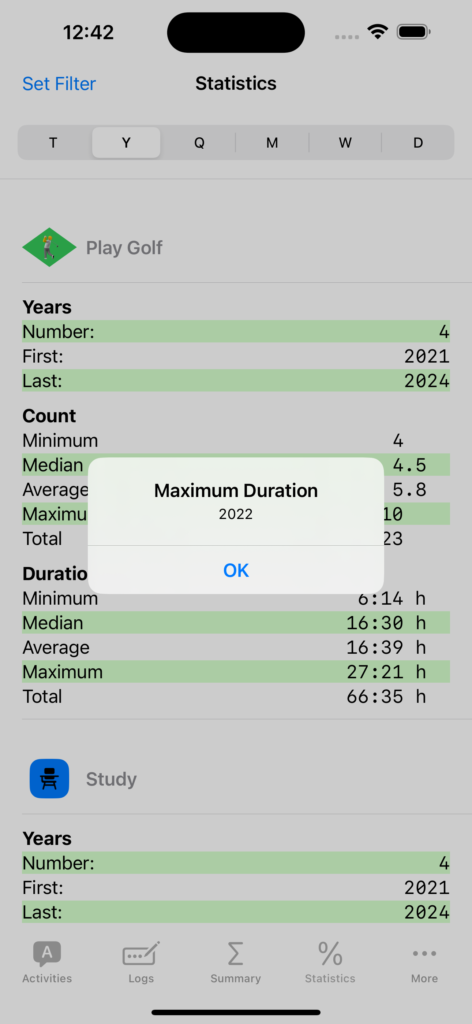
For each activity and each chosen period (from daily to total) the following statistics are calculated and shown:
- Time Periods:
- Number of time periods
- The first and the last period
- Count and Duration:
- The minimum and maximum count/sum of durations of logs during a period. If you tap on those lines the date when this extreme value was attained is shown in an alert box.
- The average value
- The median value. That is the 50% percentile or in other words the value for which 50% of the periods are below and 50% are above.
- The total count the total sum of durations respectively.
The “period” Total is special in that there are no periods. The statistics are based on the individual logs themselves.